2.2 — Quotas, Subsidies, & NTBs
ECON 324 • International Trade • Spring 2023
Ryan Safner
Associate Professor of Economics
safner@hood.edu
ryansafner/tradeS23
tradeS23.classes.ryansafner.com
Non-Tariff Barriers
Tariffs are the most obvious trade barrier, literally and visibly raising the cost of traded goods
More and more trade barriers today are not literal trade taxes (countries have committed to lowering tariffs)
- costs of these other barriers are often hidden, but still are very real!
- might there be political reasons for this? 🧐
In general, we call these non-tariff barriers to trade (NTBs)

Import Quotas and Export Subsidies
We will examine two today:
Import quota places a quantitative limit on the number of imported units allowed
- Developed countries usually restrict imported agriculture, developing countries usually restrict imported manufactured goods
Export subsidy is a subsidy (payment to encourage production) of exported goods
- Both developed and developing countries do this to protect politically powerful groups (e.g. agriculture)

Effects of an Import Quota in a Small Country
Import Quota Effects in a Small Country
- Consider, for example, the sugar market in Belgium

Import Quota Effects in a Small Country
Consider, for example, the sugar market in Belgium
Domestic Demand for sugar in Belgium

Import Quota Effects in a Small Country
Consider, for example, the sugar market in Belgium
Domestic Demand for sugar in Belgium
Domestic Supply of sugar in Belgium

Import Quota Effects in a Small Country
Consider, for example, the sugar market in Belgium
Domestic Demand for sugar in Belgium
Domestic Supply of sugar in Belgium
Autarky price: 10¢/lb, 10 billion lbs exchanged within Belgium

Import Quota Effects in a Small Country
Consider, for example, the sugar market in Belgium
Domestic Demand for sugar in Belgium
- Consumer surplus = WTP - p*
Domestic Supply of sugar in Belgium
Autarky price: 10¢/lb, 10 billion lbs exchanged within Belgium

Import Quota Effects in a Small Country
Consider, for example, the sugar market in Belgium
Domestic Demand for sugar in Belgium
- Consumer surplus = WTP - p*
- = 0.5(10-0)($0.20-$0.10) = $0.5 billion
Domestic Supply of sugar in Belgium
Autarky price: 10¢/lb, 10 billion lbs exchanged within Belgium

Import Quota Effects in a Small Country
Consider, for example, the sugar market in Belgium
Domestic Demand for sugar in Belgium
- Consumer surplus = WTP - p*
- = 0.5(10-0)($0.20-$0.10) = $0.5 billion
Domestic Supply of sugar in Belgium
- Producer surplus = p* - WTA
Autarky price: 10¢/lb, 10 billion lbs exchanged within Belgium

Import Quota Effects in a Small Country
Consider, for example, the sugar market in Belgium
Domestic Demand for sugar in Belgium
- Consumer surplus = WTP - p*
- = 0.5(10-0)($0.20-$0.10) = $0.5 billion
Domestic Supply of sugar in Belgium
- Producer surplus = p* - WTA
- = 0.5(10-0)($0.10-$0.00) = $0.5 billion
Autarky price: 10¢/lb, 10 billion lbs exchanged within Belgium

Import Quota Effects in a Small Country
Consider, for example, the sugar market in Belgium
Domestic Demand for sugar in Belgium
Domestic Supply of sugar in Belgium
Suppose Belgium opens up to international trade
World Supply of sugar at 4¢/lb

Import Quota Effects in a Small Country
- At 4¢/lb:
- Belgian consumers want to consume 16 bn lbs

Import Quota Effects in a Small Country
- At 4¢/lb:
- Belgian consumers want to consume 16 bn lbs
- Belgian producers will produce 4 bn lbs

Import Quota Effects in a Small Country
- At 4¢/lb:
- Belgian consumers want to consume 16 bn lbs
- Belgian producers will produce 4 bn lbs
- Belgium will import 12 bn lbs from the rest of the world

Import Quota Effects in a Small Country
Under international trade:
Consumer surplus = WTP - p*
- = 0.5(16-0)($0.20-$0.04) = $1.280 billion

Import Quota Effects in a Small Country
Under international trade:
Consumer surplus = WTP - p*
- = 0.5(16-0)($0.20-$0.04) = $1.280 billion
Producer surplus = p* - WTA
- = 0.5(4-0)($0.04-$0.00) = $0.080 billion

Import Quota Effects in a Small Country
Under international trade:
Consumer surplus = WTP - p*
- = 0.5(16-0)($0.20-$0.04) = $1.280 billion
Producer surplus = p* - WTA
- = 0.5(4-0)($0.04-$0.00) = $0.080 billion
Trade benefits Belgian consumers at expense of Belgian sugar producers
- But gain is much bigger than loss!

Import Quota Effects in a Small Country


We can trace Belgium’s import demand from the world based on the world price
Note at a price of ¢10 there is no import demand, all sugar can be produced in Belgium
Import Quota Effects in a Small Country


We can trace Belgium’s import demand from the world based on the world price
Note at a price of ¢10 there is no import demand, all sugar can be produced in Belgium
We have been assuming the world supply of sugar is perfectly elastic at 4¢
Sets equilibrium amount of imports in Belgium, 12 bn lbs imported
Import Quota Effects in a Small Country
- Suppose instead of a 4¢/lb tariff on imports, government limits sugar imports to 4 bn lbs

Import Quota Effects in a Small Country
Suppose the government puts a 4 bn lb quota on sugar imports
At new domestic sugar price of 8¢/lb

Import Quota Effects in a Small Country
Suppose the government puts a 4 bn lb quota on sugar imports
At new domestic sugar price of 8¢/lb
- Belgian consumers want to consume 12 bn lbs (less than before)

Import Quota Effects in a Small Country
Suppose the government puts a 4 bn lb quota on sugar imports
At new domestic sugar price of 8¢/lb
- Belgian consumers want to consume 12 bn lbs (less than before)
- Belgian producers will produce 8 bn lbs (more than before)

Import Quota Effects in a Small Country
Suppose the government puts a 4 bn lb quota on sugar imports
At new domestic sugar price of 8¢/lb
- Belgian consumers want to consume 12 bn lbs (less than before)
- Belgian producers will produce 8 bn lbs (more than before)
- Belgium will import 4 bn lbs from the rest of the world (less than before)
Quota will generate quota rents: 4 bn lbs × 0.04/lb = $0.160 bn
- more on this in a moment

Import Quota Effects in a Small Country
Under the quota:
Consumer surplus = WTP - p*
- = 0.5(12-0)($0.20-$0.08) = $0.720 billion
- Less than before (free trade)

Import Quota Effects in a Small Country
Under the quota:
Consumer surplus = WTP - p*
- = 0.5(12-0)($0.20-$0.08) = $0.720 billion
- Less than before (free trade)
Producer surplus = p* - WTA
- = 0.5(8-0)($0.08-$0.00) = $0.320 billion
- More than before (free trade)

Import Quota Effects in a Small Country
Under the quota:
Two new sources of market inefficiency created, “deadweight loss (DWL)”

Import Quota Effects in a Small Country
Under the quota:
Two new sources of market inefficiency created, “deadweight loss (DWL)”
- Inefficient domestic production (cheaper for foreigners to produce sugar)
- 0.5(8-4)($0.08-$0.04) = $0.080 Billion

Import Quota Effects in a Small Country
Under the quota:
Two new sources of market inefficiency created, “deadweight loss (DWL)”
- Inefficient domestic production (cheaper for foreigners to produce sugar)
- 0.5(8-4)($0.08-$0.04) = $0.080 Billion
- Lost gains from exchange (consumers wanted to buy more from world)
- 0.5(16-12)($0.08-$0.04) = $0.080 Billion

Import Quota Effects in a Small Country


Can also see this in the import market
Decline of imports at higher price in Belgium
Size of DWL in import market = sum of both DWL triangles in Belgian market ($0.160 bn)
Import Quota Effects in a Small Country
- Domestic consequences of quota:
Decrease in consumer surplus:
- $0.720 bn-$1.280 bn = -$0.460 bn
Increase in producer surplus:
- $0.320 bn-$0.080 bn = $0.240 bn
Quota rents:
- $0.160 bn
Deadweight losses
- $-0.080 bn - $0.080 bn = -$0.160 bn

Quota Rents
Government gets tax revenues from tariffs, but who gets the quota rents?
Government grants licenses for the “right to import” to firms (domestic or foreign)
- Gives a fixed number of licenses (4 bn lbs worth) for firms to import at low world price (4¢/lb) and resell at artificially higher domestic price (8¢/lb) for 4¢/lb profit

Quota Rents
Government could auction licenses to the highest bidder outright; sell them to firms
- Firms willing to pay up to the full $0.160 bn (value of additional profit from holding the import licenses)
- In this case, government would gain the full $0.160 bn as revenue
Unfortunately, this is rarely done

Quota Rents
Government often merely gives permissions or licenses to various firms, government would get no revenue out of this
Sounds like these firms just get the licenses for free?
- No! Rent-seeking: firms compete to lobby the government to give the quota licenses to their firm and not other firms!
- The privilege of having a scarce import license creates economic rents above opportunity cost
- Firms gain $0.160 bn value of additional profit from holding the import licenses

Quota Rents
It’s impossible to give something away for free in politics! People will always expend resources to compete to make sure they are the one that gets the handout
- campaign contributions, lobbying expenditures, etc.
Competition between firms seeking the rent will waste resources
- Each firm is willing to pay up to $0.160 bn value to obtain the import licenses!
- The economic rents of the license are competed away via wasteful investments!

Rent-Seeking I

Anne Kreuger
1934-
“In many market-oriented economies, government restrictions upon economic activity are pervasive facts of life. These restrictions give rise to rents of a variety of forms, and people often compete for the rents. Sometimes, such competition is perfectly legal. In other instances, rent seeking takes other forms, such as bribery, corruption, smuggling, and black markets.”
“When quantitative restrictions are imposed upon and effectively constrain imports, an import license is a valuable commodity...It has always been recognized that there are some costs associated with licensing: paperwork, the time spent by entrepreneurs in obtaining their licenses, the cost of the administrative apparatus necessary to issue licenses, and so on. Here, the argument is carried one step further: in many circumstances resources are devoted to competing for those licenses,” (p.848).
Kreuger, Anne, 1974, “The Political Economy of the Rent-Seeking Society,” American Economic Review 84(4): 833-850
Rent-Seeking II

Kreuger, Anne, 1974, “The Political Economy of the Rent-Seeking Society,” American Economic Review 84(4): 833-850
Voluntary Export Restraints
Until 1970s, U.S. automakers dominated U.S. auto market and sold very different varieties of cars that most Americans preferred over foreign cars
Oil crises of the 1970s, U.S. car production fell by about 30%, 300,000 lost auto jobs in Detroit, imports rose from 18%-29% of all car sales
Japanese car manufacturers increasing share of the market with cheaper, more fuel-efficient cars
U.S. and Japan negotiated a trade agreement that limited Japanese auto exports to the U.S. to 1.86 million in 1981, and to 1.85 million for 1984-1985 (failed to renew in 1985)

Voluntary Export Restraints
Volunetary Export Restraints (VERs) Japan “agreed” to restrict its auto exports to U.S. (for fear of wider-ranging U.S. protectionism if this failed)
U.S. automakers used the time to increase quality, but not passed onto consumers — U.S. automakers earned $6 billion in profit in 1983, $10 billion in 1984, $8 billion in 1985
American public had to pay about $660 higher per American car, and $1,300 per Japanese car in 1984
Estimated total cost of VER to U.S. consumers was $15.7 billion (1984-1981), and 44,000 U.S. jobs protected.

Export Subsidies
Export Subsidy
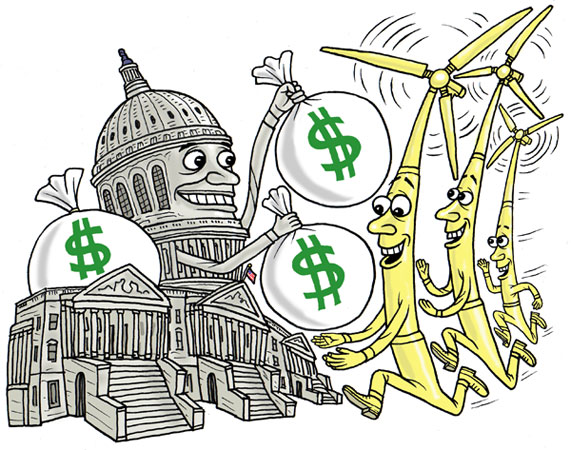
- Export subsidy: government pays domestic firms for every unit they export
- essentially, a negative tax on exports
Export Subsidy Effects
- Consider, for example, the wheat market in the U.S.

Export Subsidy Effects
Consider, for example, the wheat market in the U.S.
Domestic Demand for wheat in U.S.

Export Subsidy Effects
Consider, for example, the wheat market in the U.S.
Domestic Demand for wheat in U.S.
Domestic Supply of wheat in U.S.

Export Subsidy Effects
Consider, for example, the wheat market in the U.S.
Domestic Demand for wheat in U.S.
Domestic Supply of wheat in U.S.
Autarky price: $10/bushel, 10 billion bushels exchanged within U.S.

Export Subsidy Effects
Consider, for example, the wheat market in the U.S.
Domestic Demand for wheat in U.S.
- Consumer surplus = WTP - p*
Domestic Supply of wheat in U.S.
Autarky price: $10/bushel, 10 billion bushels exchanged within U.S.

Export Subsidy Effects
Consider, for example, the wheat market in the U.S.
Domestic Demand for wheat in U.S.
- Consumer surplus = WTP - p*
- = 0.5(10-0)($20-$10) = $50 billion
Domestic Supply of wheat in U.S.
Autarky price: $10/bushel, 10 billion bushels exchanged within U.S.

Export Subsidy Effects
Consider, for example, the wheat market in the U.S.
Domestic Demand for wheat in U.S.
- Consumer surplus = WTP - p*
- = 0.5(10-0)($20-$10) = $50 billion
Domestic Supply of wheat in U.S.
- Producer surplus = p* - WTA
Autarky price: $10/bushel, 10 billion bushels exchanged within U.S.

Export Subsidy Effects
Consider, for example, the wheat market in the U.S.
Domestic Demand for wheat in U.S.
- Consumer surplus = WTP - p*
- = 0.5(10-0)($20-$10) = $50 billion
Domestic Supply of wheat in U.S.
- Producer surplus = p* - WTA
- = 0.5(10-0)($10-$0) = $50 billion
Autarky price: $10/bushel, 10 billion bushels exchanged within U.S.

Export Subsidy Effects
Consider, for example, the wheat market in U.S.
Domestic Demand for wheat in U.S.
Domestic Supply of wheat in U.S.
Suppose U.S. opens up to international trade
World Demand for U.S. wheat at $12/bushel

Export Subsidy Effects
- At $12/bushel:
- U.S. consumers want to consume 8 bn bushels

Export Subsidy Effects
- At $12/bushel:
- U.S. consumers want to consume 8 bn bushels
- U.S. producers will produce 12 bn bushels

Export Subsidy Effects
- At $12/bushel:
- U.S. consumers want to consume 8 bn bushels
- U.S. producers will produce 12 bn bushels
- U.S. will export 4 bn bushels to the rest of the world

Export Subsidy Effects
Under international trade:
Consumer surplus = WTP - p*
- = 0.5(8-0)($20-$12) = $32 billion

Export Subsidy Effects
Under international trade:
Consumer surplus = WTP - p*
- = 0.5(8-0)($20-$12) = $32 billion
Producer surplus = p* - WTA
- = 0.5(12-0)($12-$0.00) = $72 billion

Export Subsidy Effects
Under international trade:
Consumer surplus = WTP - p*
- = 0.5(8-0)($20-$12) = $32 billion
Producer surplus = p* - WTA
- = 0.5(12-0)($12-$0.00) = $72 billion
Trade benefits U.S. producers at expense of U.S. consumers
- But gain is much bigger than loss!

Export Subsidy Effects


We can trace U.S.’s export demand to the world based on the world price
Note at a price of $10 there is no export demand, all wheat will be sold in U.S.
Export Subsidy Effects


We can trace U.S.’s export supply to the world based on the world price
Note at a price of $10 there is no export supply, all wheat will be sold in U.S.
We have been assuming the world demand of wheat is perfectly elastic at $12
Sets equilibrium amount of exports in U.S., 4 bn bushels exported
Export Subsidy Effects
- Suppose the U.S. government pays a $4/bushel subsidy on wheat exports

Export Subsidy Effects
Suppose the U.S. government pays a $4/bushel subsidy on wheat exports
At new domestic wheat price of $16/bushel

Export Subsidy Effects
Suppose the U.S. government pays a $4/bushel subsidy on wheat exports
At new domestic wheat price of $16/bushel
- U.S. consumers want to consume 4 bn lbs (less than before)

Export Subsidy Effects
Suppose the U.S. government pays a $4/bushel subsidy on wheat exports
At new domestic wheat price of $16/bushel
- U.S. consumers want to consume 4 bn lbs (less than before)
- U.S. producers will produce 16 bn lbs (more than before)

Export Subsidy Effects
Suppose the U.S. government pays a $4/bushel subsidy on wheat exports
At new domestic wheat price of $16/bushel
- U.S. consumers want to consume 4 bn lbs (less than before)
- U.S. producers will produce 16 bn lbs (more than before)
- U.S. will export 12 bn lbs (more than before)
Subsidy is a government payment, so taxpayers must spend money: $4/bushel × 12 bn bushels = \$48 bn

Export Subsidy Effects
Under the subsidy:
Consumer surplus = WTP - p*
- = 0.5(4-0)($20-$16) = $8 billion
- Less than before (free trade)

Export Subsidy Effects
Under the subsidy:
Consumer surplus = WTP - p*
- = 0.5(4-0)($20-$16) = $8 billion
- Less than before (free trade)
Producer surplus = p* - WTA
- = 0.5(16-0)($16-$0) = $128 billion
- More than before (free trade)

Export Subsidy Effects
Under the subsidy:
New source of market inefficiency created, “deadweight loss (DWL)”
- Overproduction at home
- 0.5(16-12)($0.16-$12) = $8 Billion
Why no left triangle? The consumption loss to consumers is transferred to producers

Export Subsidy Effects


Can also see this in the export market
More exports at higher price in U.S.
Export Subsidy Effects
- Domestic consequences of subsidy:
Decrease in consumer surplus:
- $8 bn-$32 bn = -$24 bn
Increase in producer surplus:
- $128 bn-$72 bn = $56 bn
Government spending expense:
- -$48 bn
Deadweight losses
- -$8 bn

Export Subsidy Effects
Domestic consequences of subsidy:
A $56 bn gain to a small group of domestic sugar producers at a $24 bn expense to consumers, $48 bn expense to taxpayers

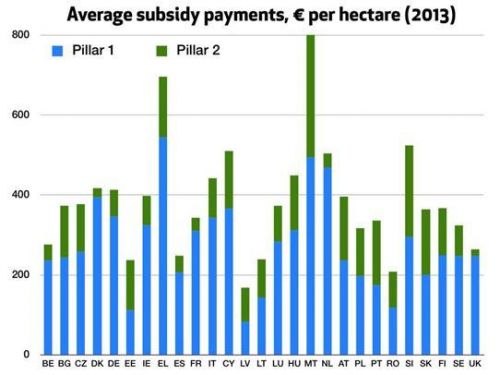
Subsidies and the European Union
Some of the biggest effects of the European Union (EU) have been on trade:
Members of the EU & Schengen agreement have removed all tariffs between member countries
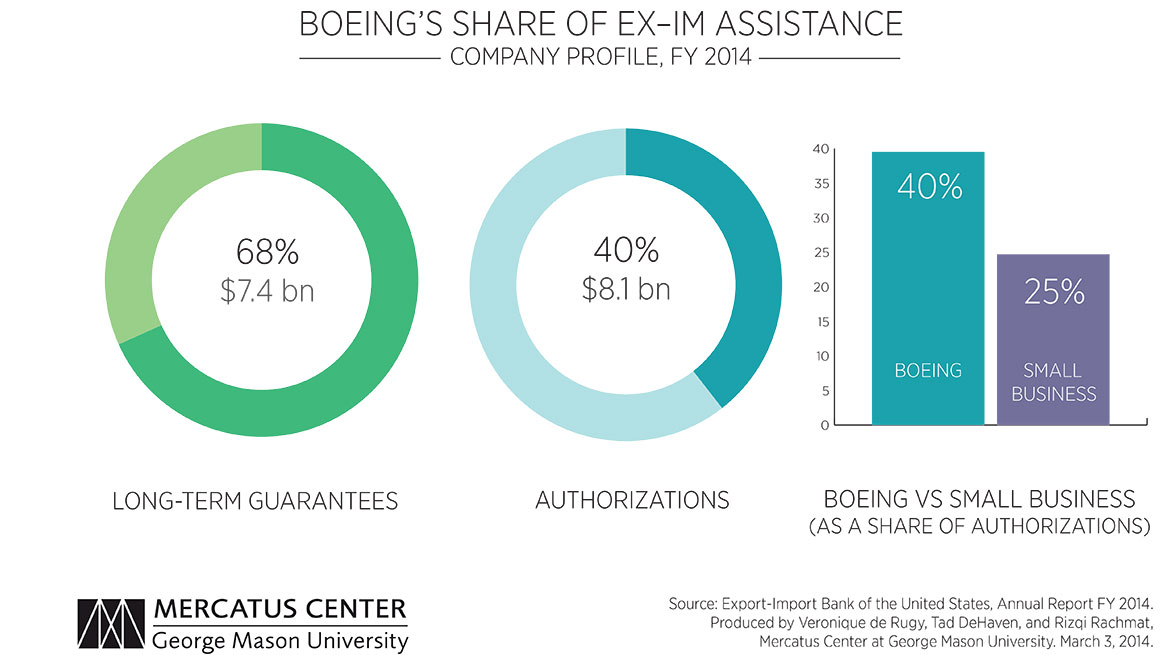
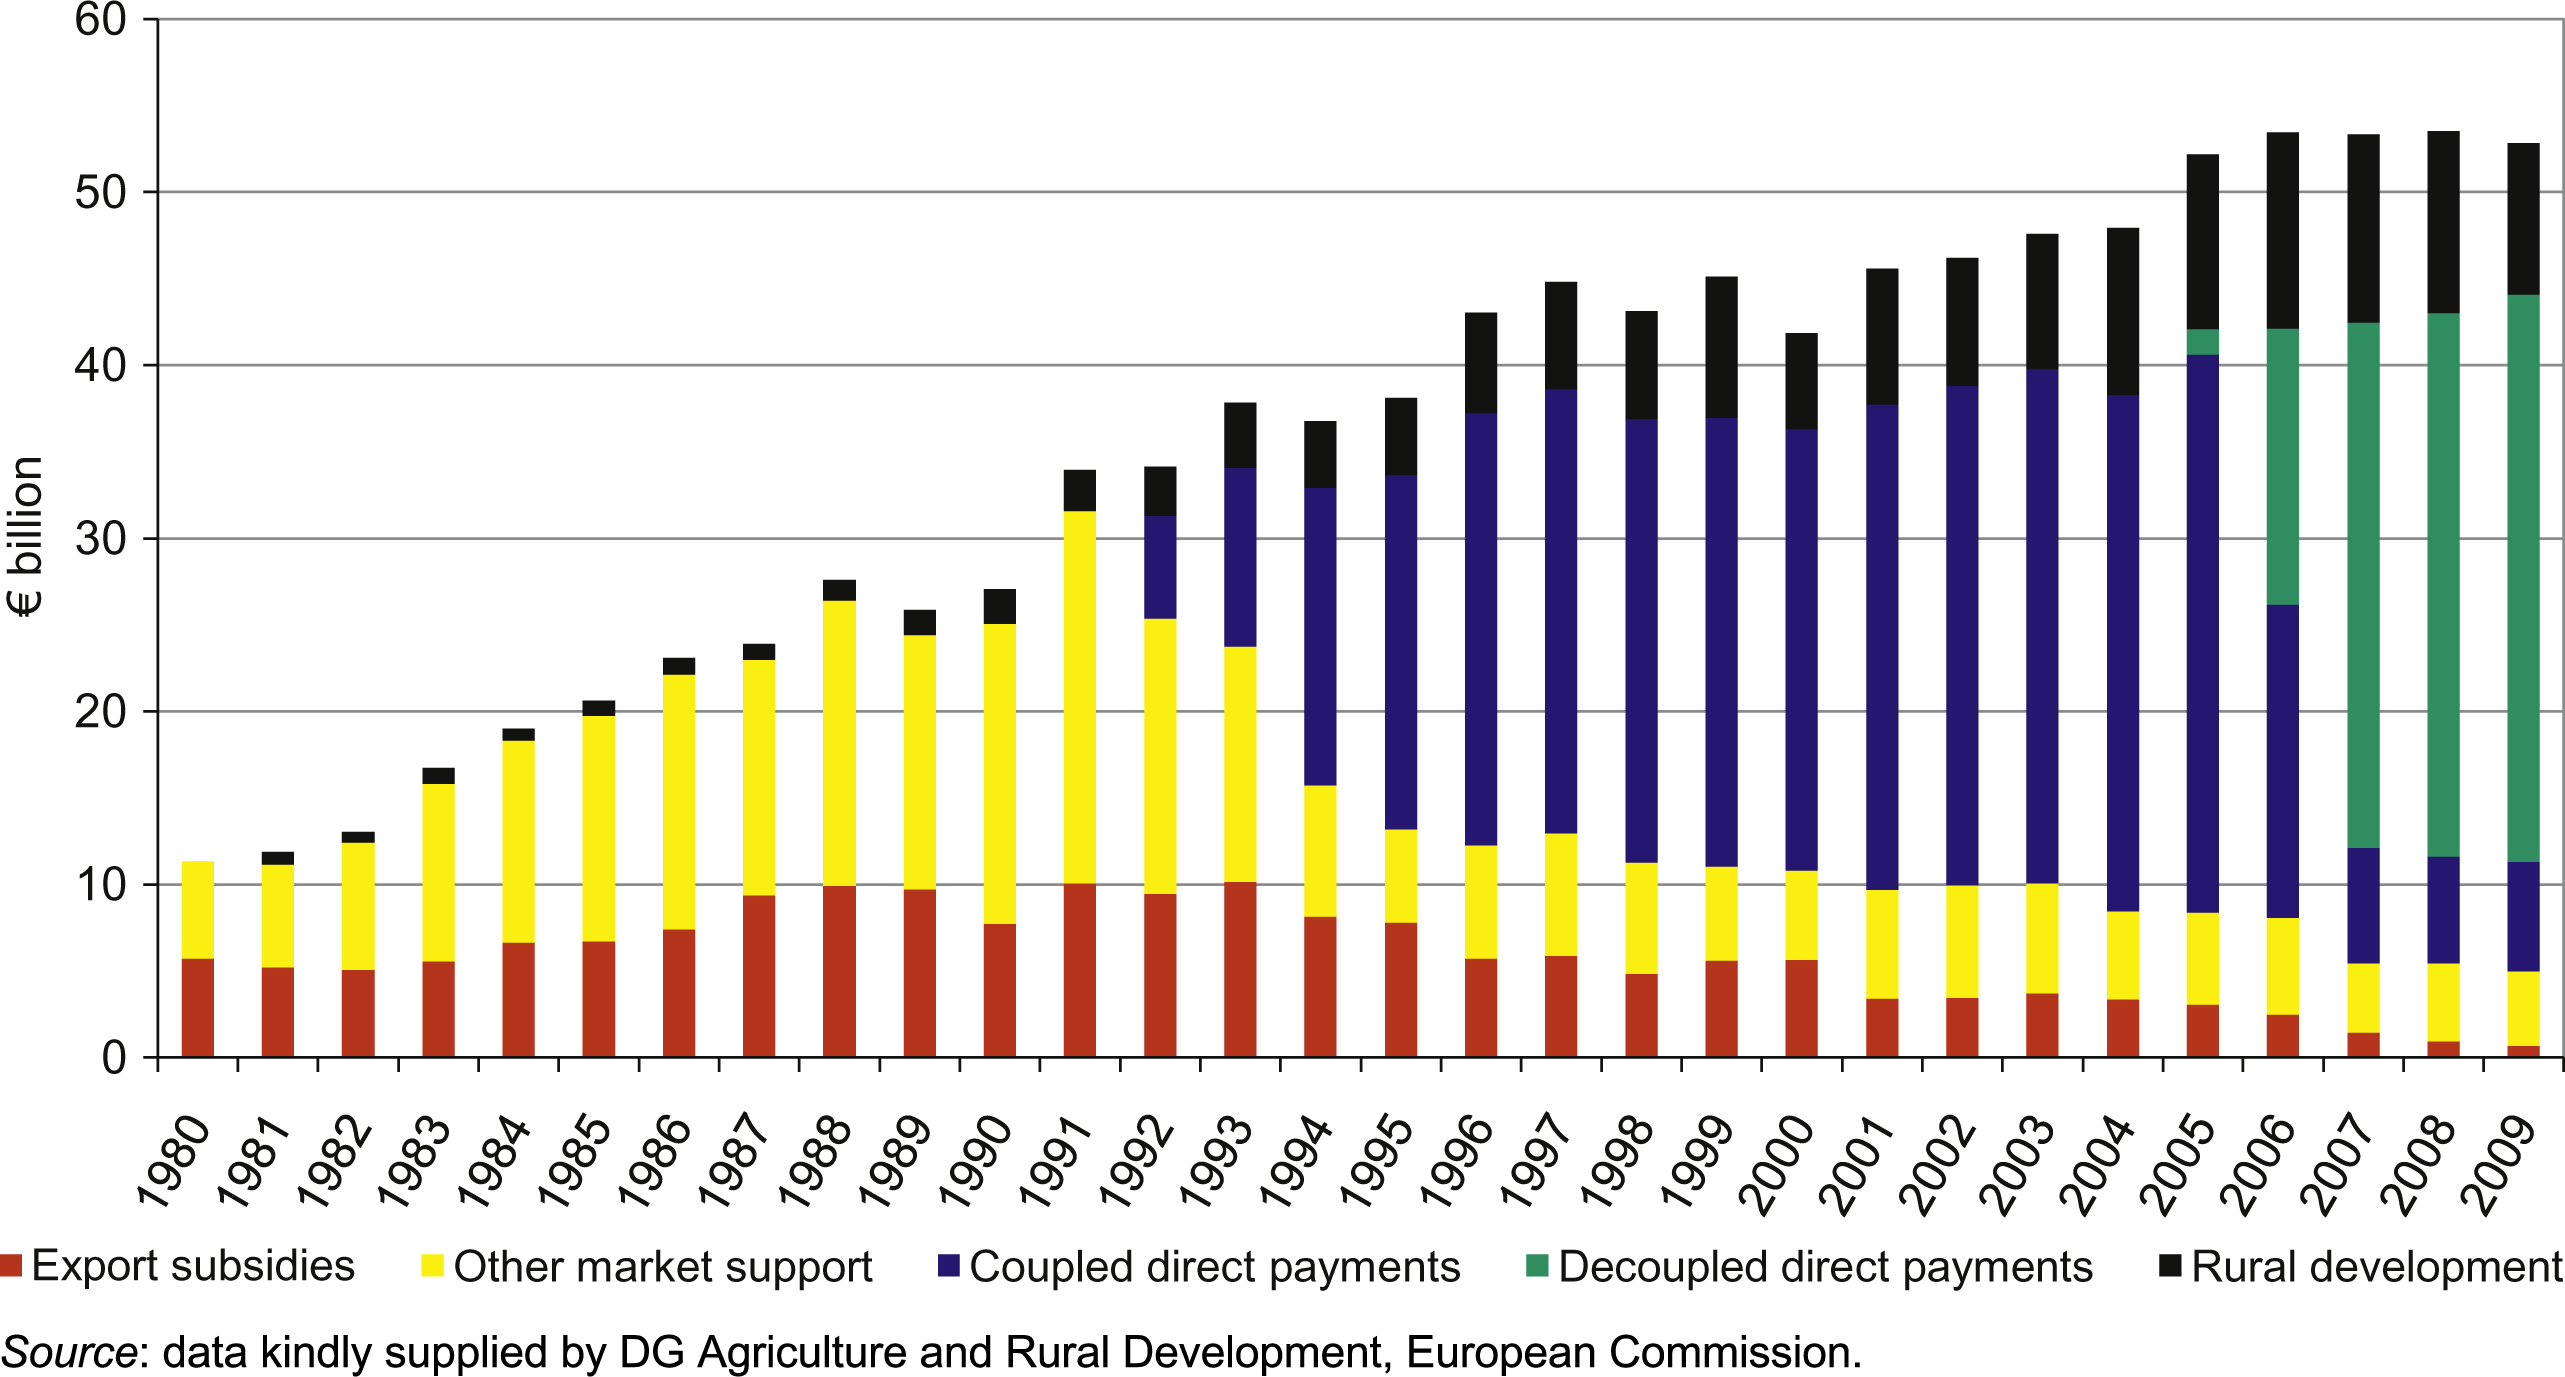
The EU’s Common Agricultural Policy (CAP) is essentially one giant continental export subsidy of European agricultural products
- protects inefficient agriculture in countries

Subsidies and the European Union
Subsidies and the European Union
Hidden Export Subsidies
Export subsidies are illegal under current international agreements
However, many nations provide them in disguised or not-so-disguised forms
- e.g. tax breaks for exporters, subsidized/low-interest loans or federal loan guarantees for exporters

Dumping
Export subsidies are a form of “dumping”, where a country sells a good at a lower price in a foreign market than it charges at home
- With an export subsidy, exporter can provide more exports at lower prices than if just selling domestically
Goal is to gain market share in the foreign country and reduce foreign competition
Similar to predatory pricing in industrial organization between firms in a market (price below cost to drive out competitors)
Very hard to “prove”

